pyBeamline full cycle
In this example we are going to see how to use pyBeamline to go all the way from the simulation of an MQTT-XES stream to its mining and the visualization of the results as a Petri net that changes over time.
The picture below depicts the architecture of the example.
There is an MQTT Broker at the center. The Emitter is in charge of generating the events as MQTT-XES. The Miner, which is subscribed to the MQTT-XES, consumes the events and performs the discovery. It also publishes the models (as Graphviz DOR render of a Petri net) back into the MQTT broker. The ResultVisualizer is a static webpage that connects to the MQTT Broker and subscribes to the models which are rendered and presented as output.
All these components can be tested without the need to install anything: it is possible to use a public MQTT broker, the Emitter and the Miner can be hosted on Google Colab (see links below in each section), and a deployment of ResultVisualizer is also available (see link below).
The Emitter component
The Emitter first defines the destination of the MQTT messages, after that a list of all possible traces (referring to a process that contains a sequence, a parallel split/join and an XOR split/join) is reported and finally the system connects to the MQTT broker and starts an infinite loop that publishes one event after the other according to the MQTT-XES specification.
Here is the complete code of the Emitter:
Currently, between each event, the scripts waits for 0.5 seconds.
Please note that this code is not terminating on purpose: the goal is that events are continuously generated and the generation stops when the script is forced to terminate.
The Miner component
In order to configure the Miner component it is necessary to specify the two MQTT endpoints referring to where the event messages are sent and where the model updates should be published.
The script ensures a connection to the MQTT endpoint, then it defines a function to transform the Heuristics Net (produced by heuristics_miner_lossy_counting_budget into the Graphviz DOT representation of the translated Petri net) leveraging the PM4PY functions. At the very end, the pyBeamline pipeline is defined: it connects to the mqttxes_source and defines a pipeline that only contains heuristics_miner_lossy_counting_budget. The results are then processes in a lambda function that converts it to Petri net and publishes them to the MQTT broker.
Here is the complete code of the Miner:
Please note that the input() at the very end ensures that the script does not terminate.
The Result Visualizer component
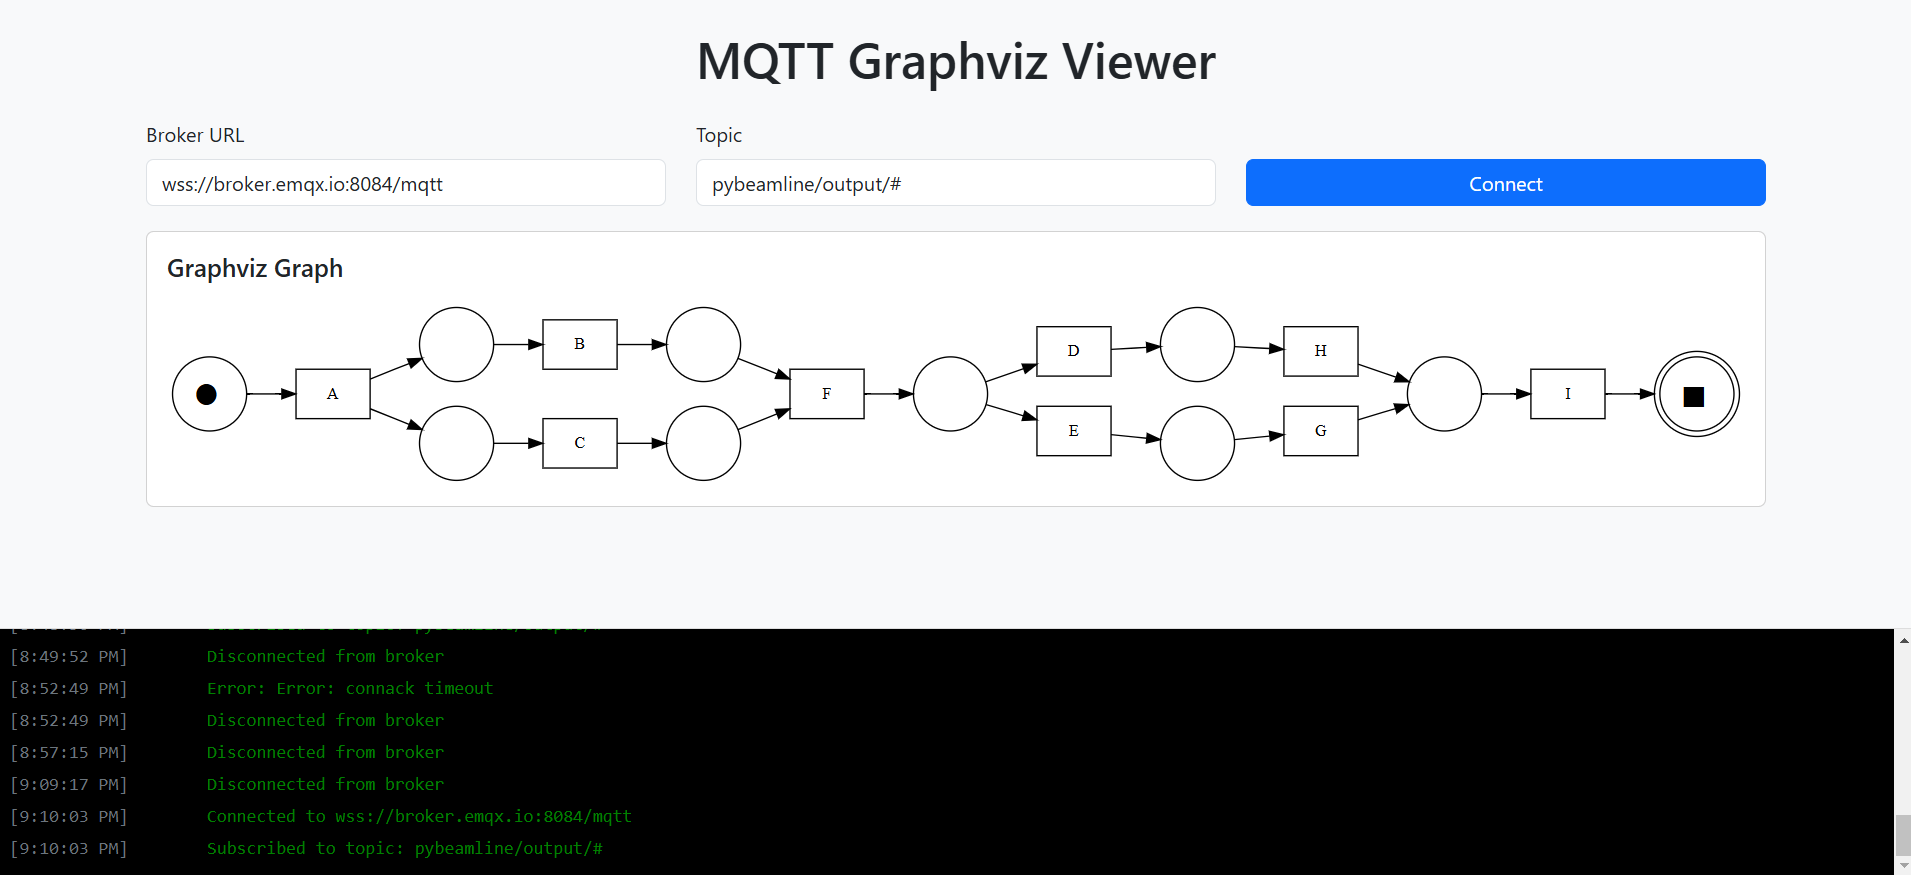
This component is just a static HTML page that connects to the MQTT broker (via web sockets, which must be enabled on the MQTT broker) and subscribes to messages on a certain topics. The payload of the message is assumed to be a Graphviz DOT string (as produced by the Miner) and is then converted into and SVG picture which is displayed and updated with each message.
A deployment of such component is available at https://people.compute.dtu.dk/andbur/mqtt-graphviz/ and source code is available at https://github.com/beamline/examples-pybeamline/blob/main/full-cycle-example/mqtt-graphviz-visualizer.html. A screenshot of such page is below:

The complete code of this example is available in the GitHub repository https://github.com/beamline/examples-pybeamline/tree/main/full-cycle-example.